Microsoft 365 Usage Analytics
#microsoft 365, #office 365 tenant
Decision-makers want to understand how effectively organizations are transforming their digital workplace, so it is critical for them to know how employees are adopting Microsoft 365. People who drive adoption have to measure and track the way users are engaging with Microsoft 365 services to better plan user training and communication to increase usage and ensure the organization gets the most from Microsoft 365.
Microsoft 365 Usage Analytics in Power BI combines Microsoft 365 service usage information with metadata in the organization's Azure Active Directory. This combination provides rich analytical capabilities to reinforce usage insights for your company.

The dashboard helps you understand how Microsoft 365 solutions are used in your company, as it provides specific usage insights to detect trends about your organization's use of the services.
At the top of the report, you can immediately see user activity across Microsoft 365 products and services, including active users versus returning users and the total number of users assigned a Microsoft subscription.
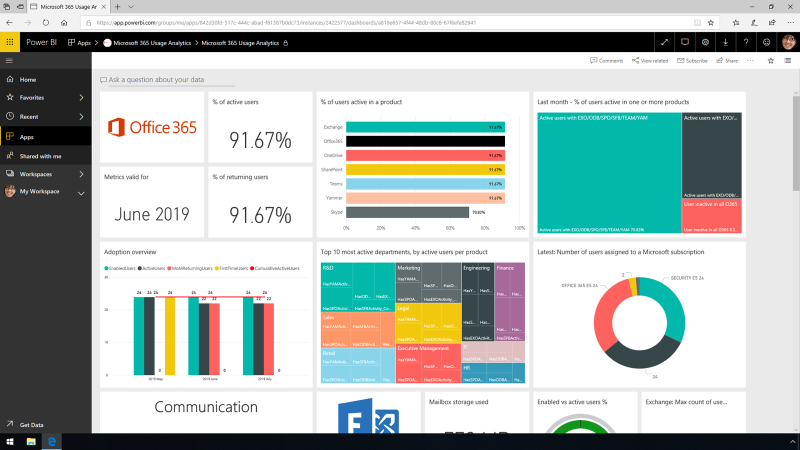
Adoption reports show an all-up summary of adoption trends and product usage over time, so it is possible to see how users have adopted Microsoft 365.
In the Adoption overview report, for example, you can examine how usage of the individual services has changed month by month. The report also shows the cumulative trend of the users who were active in the product at least once.
With this information, you can identify the products where additional user training is needed to increase adoption.
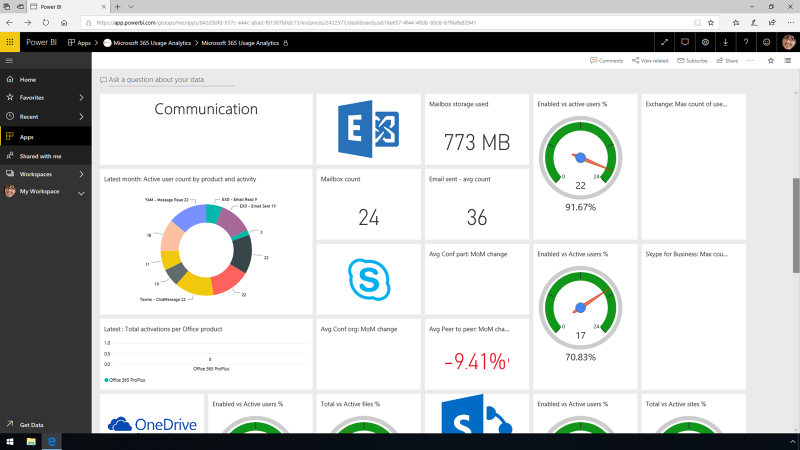
The Communication area shows you information about the various communication techniques used in the organization. You can check the way your employees are using email, Skype for Business, Teams, and Yammer to cooperate with each other and get work done.
With new tools, you will know how users adopt each of the communication-related products, and the most popular clients they use for communication.
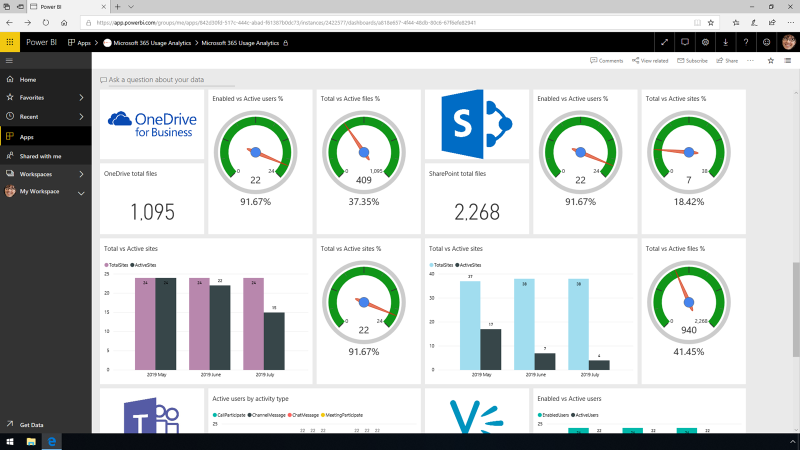
A collection of cards shows the way employees store files and work together. You can also check on the number of users enabled and active, and how their activity has altered month by month. This will help you understand how content is used on the sites over time.
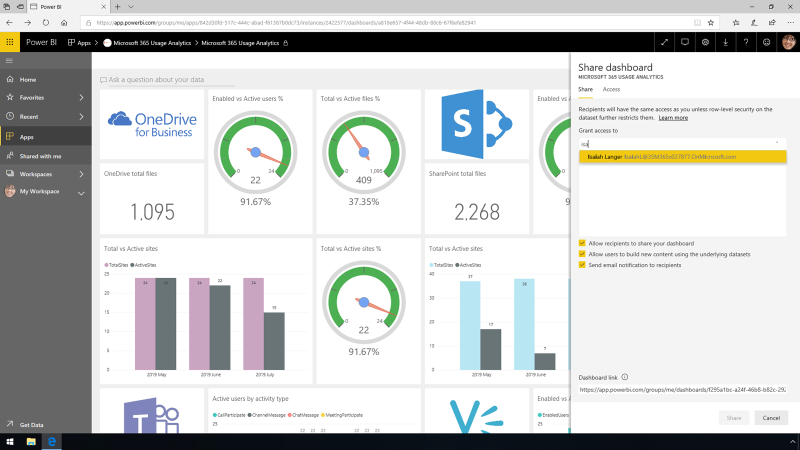
Power BI sharing lets you easily distribute the dashboard to anybody so others can analyze and filter the data but cannot change the visuals unless you grant permissions.
Microsoft 365 enables users to become more efficient and to cooperate with others to get their work done. Microsoft 365 Usage Analytics in Power BI combines the power of Microsoft 365 usage data and Azure Active Directory data with the Power BI interactive analysis to provide Microsoft 365 admins with richer usage insights.
Share
2019-12-10